
 Elliott Wave Theory, developed by Ralph Nelson Elliott in the 1930s, is a popular tool used by traders and analysts to predict future market movements by identifying patterns in price charts. One of the key corrective patterns in this theory is the Double Zigzag, a complex structure that provides insights into market corrections. This article delves into the intricacies of the Double Zigzag pattern, explaining its formation, characteristics, and practical applications.
What is a Double Zigzag?
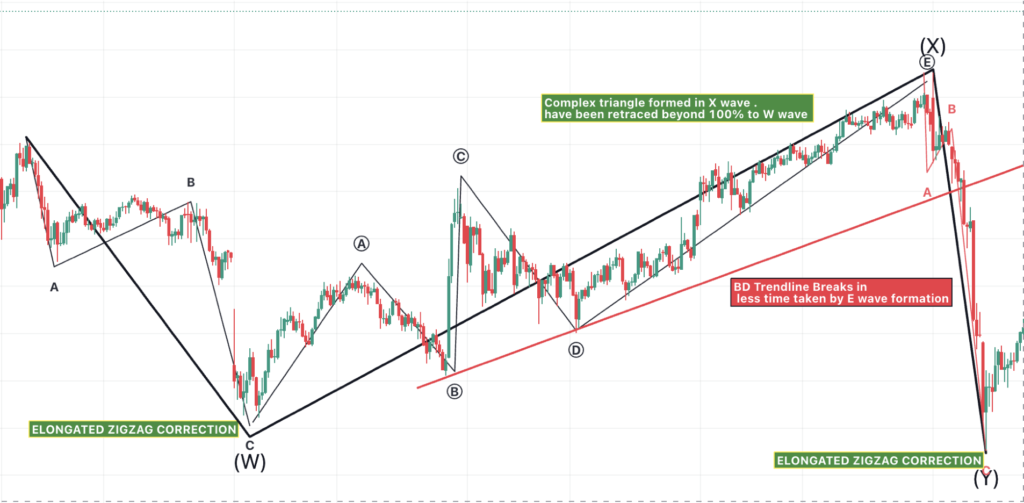
A Double Zigzag is a complex corrective pattern that consists of two simpler Zigzag patterns connected by an intervening wave, known as the X wave. The notation for this pattern is W-X-Y, where:
- W wave: The first Zigzag pattern.
- X wave: The connecting wave.
- Y wave: The second Zigzag pattern.
This pattern typically unfolds during market corrections and helps in understanding the depth and duration of these corrections.
Formation and Structure
To fully grasp the Double Zigzag pattern, it’s essential to break down its components:
- W Wave: The initial Zigzag pattern consists of three sub-waves (A-B-C). This wave moves against the prevailing trend and forms the first part of the correction.
- X Wave: This is a corrective wave that connects the W wave to the Y wave. It typically retraces between 50% to 79% of the W wave. However, in some cases, it can extend beyond 100% of the W wave, indicating a more complex correction.
- Y Wave: The second Zigzag pattern, similar to the W wave, also consists of three sub-waves (A-B-C). It completes the Double Zigzag pattern and generally moves in the same direction as the W wave.
Identifying a Double Zigzag
Recognising a Double Zigzag on a price chart involves several steps:
- Identify the First Zigzag (W wave): Look for a clear A-B-C formation that moves against the primary trend.
- Spot the X Wave: This wave should retrace a significant portion of the W wave. If the retracement is between 50% and 79%, it’s more likely to be a part of a Double Zigzag. However, keep an eye out if it exceeds 100%, as it might suggest a complex correction.
- Confirm the Second Zigzag (Y wave): After the X wave, look for another A-B-C formation that aligns with the W wave in direction and structure.
Characteristics and Importance
The Double Zigzag pattern is characterized by its relatively sharp and deep corrections. Unlike simpler corrective patterns, the Double Zigzag allows for a more extended and complex price movement, making it crucial for traders to recognize and understand its implications. Here are some key characteristics:
- Depth and Duration: Double Zigzags often cover a larger price range and take more time to complete compared to single Zigzags.
- Complexity: The presence of the X wave makes this pattern more intricate, requiring careful analysis and patience.
- Market Psychology: This pattern reflects prolonged market indecision and correction, offering insights into trader sentiment and potential reversal points.
Practical Applications
For traders and analysts, understanding the Double Zigzag pattern can be highly beneficial:
- Trend Analysis: Identifying a Double Zigzag helps in determining the end of a corrective phase and the resumption of the primary trend.
- Entry and Exit Points: Recognizing the completion of a Double Zigzag can signal potential entry or exit points, optimizing trading strategies.
- Risk Management: By understanding the depth and duration of corrections, traders can better manage risk and set appropriate stop-loss levels.
Conclusion
The Double Zigzag pattern in Elliott Wave Theory is a vital tool for understanding market corrections. Its complex structure and characteristics provide deeper insights into market behavior, helping traders make informed decisions. By mastering the identification and interpretation of this pattern, traders can enhance their analytical skills and improve their trading strategies. As with all technical analysis tools, it is important to combine the Double Zigzag pattern with other indicators and analyses to increase the accuracy and reliability of market predictions.
